
10juil 2024
WORLD MARKET OF OLIVE OIL AND TABLE OLIVES – DATA FROM JUNE 2024
The market is expecting the first production forecasts for the 2024/2025 crop year. The price of extra virgin olive oil (EVOO) in Jaén (Spain) fell by 12% in June from its January peak of €902.5 per 100 kg.
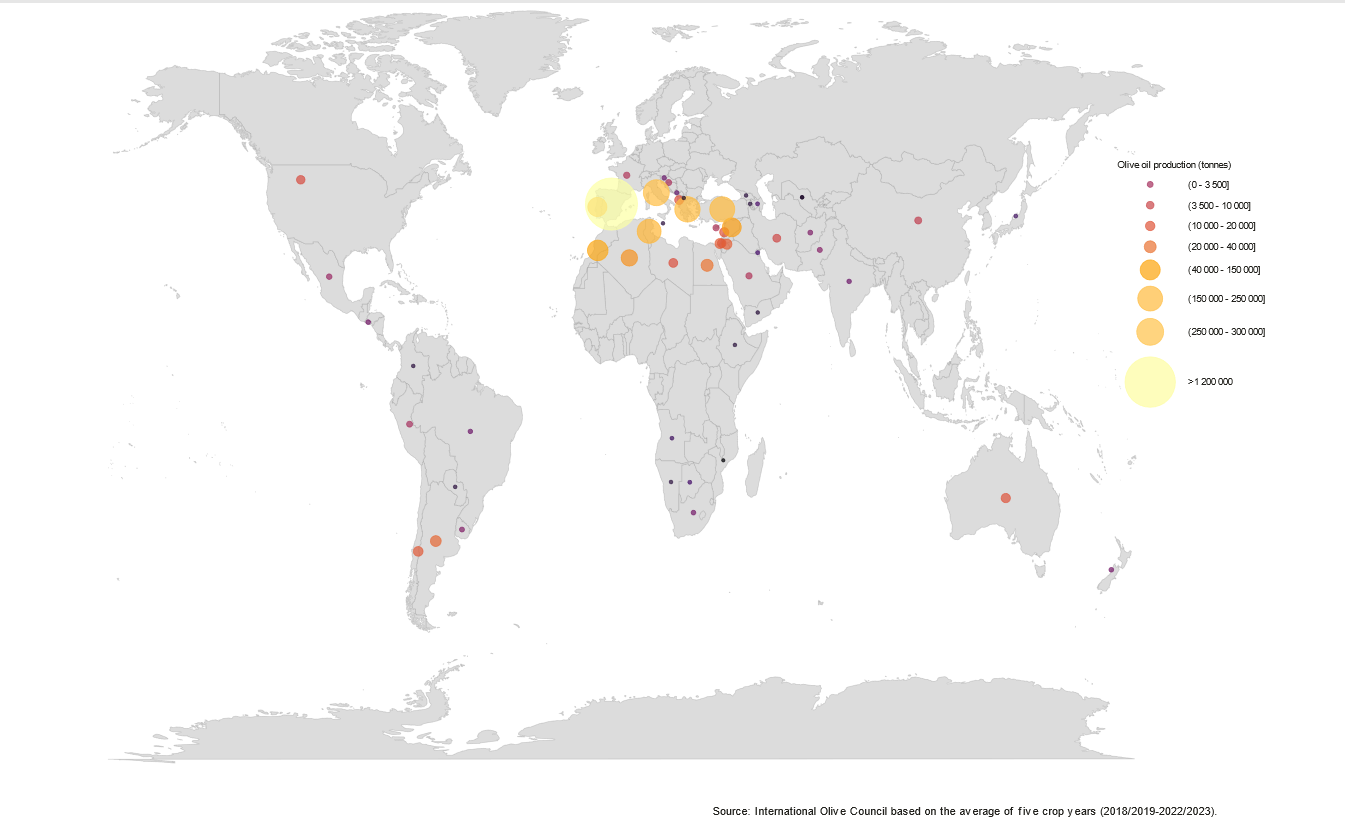
Graph 1: Average olive oil production from 2018/2019 to 2022/2023.
Figures for the third week of June put the producer price in Jaén for EVOO at €794.5 per 100 kg (+ 23.2% on the same period last year). In Bari (Italy), the figure is €950 per 100 kg (+ 31.9%).
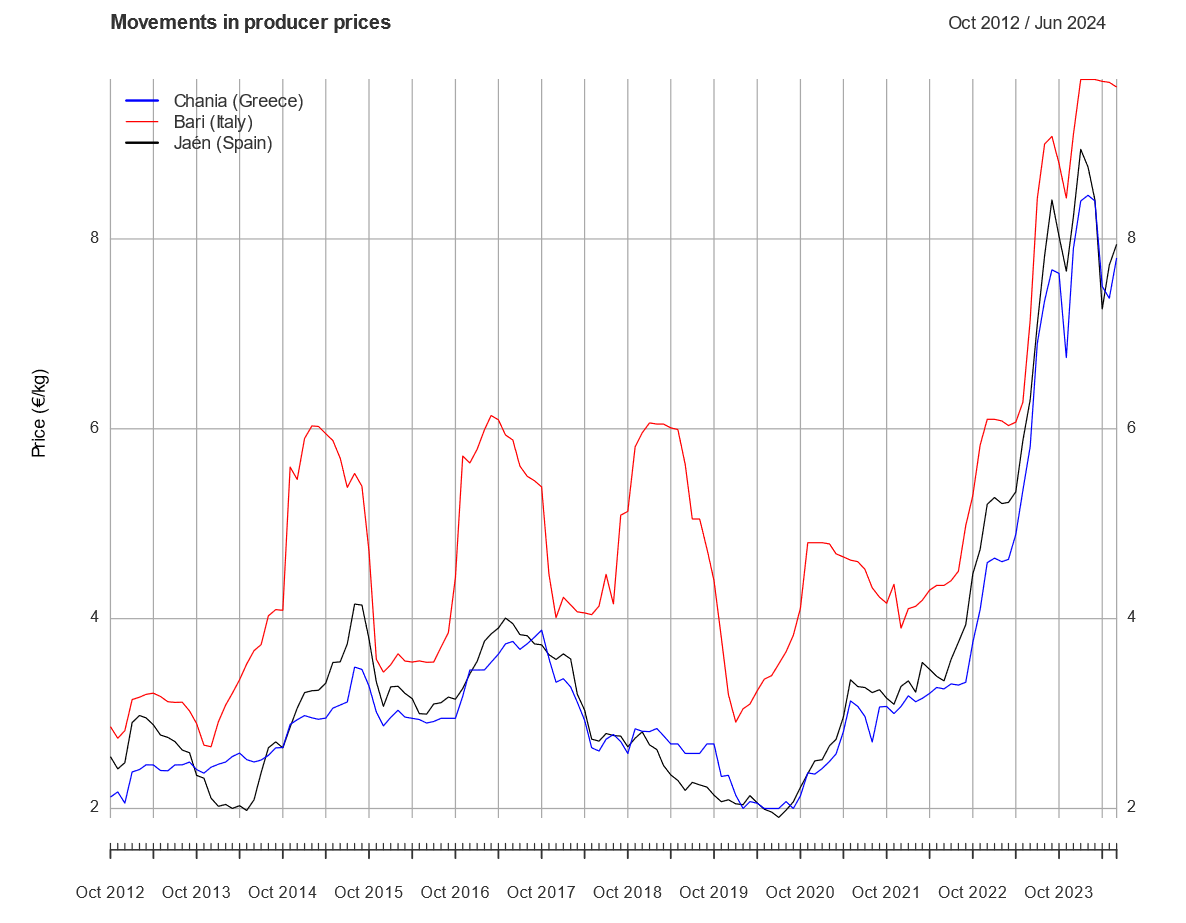
Graph 2: Monthly price trends for EVOO.
In April of the 2023/2024 crop year, extra-EU olive oil exports had a unit value of €975 per 100 kg (+59.6% on the same period of the previous crop year, or -0.5% on the previous month). The unit value of the EVOO category has exceeded €1,000 per 100 kg since March.
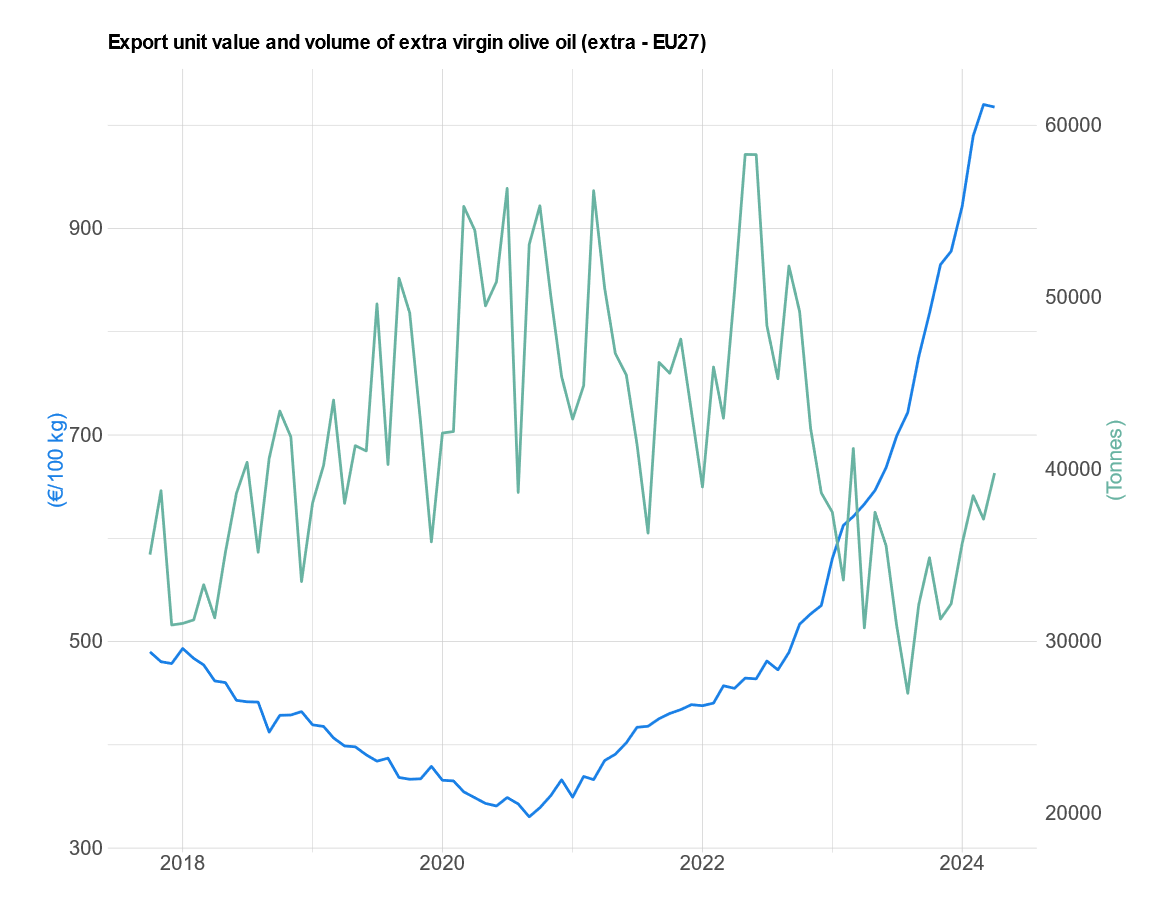
Graph 3: Monthly evolution of unit value (FOB) and volume of EVOO exports from the European Union. Volume in tonnes. Value in euros.
Olive oil imports from the main markets (see table below) fell by 6.3% between October 2023 and April 2024 compared with the same period of the 2022/2023 crop year.
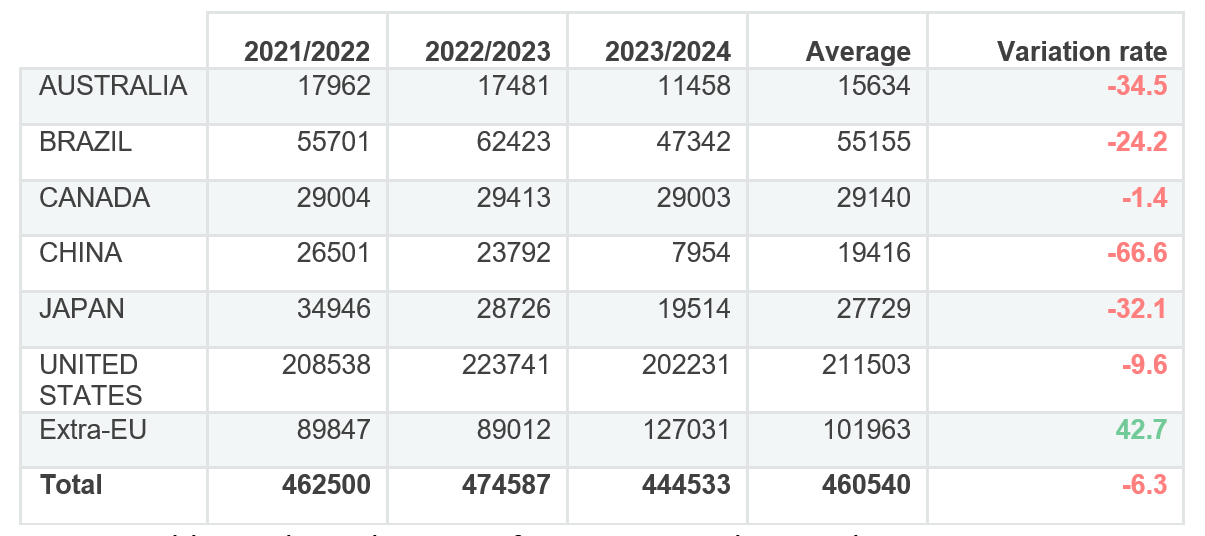
Table 1: Olive oil imports from main markets. Volume in tonnes.
In the case of table olives, imports rose by 10.6% between September 2023 and April 2024, compared with the same period of the 2022/2023 crop year.
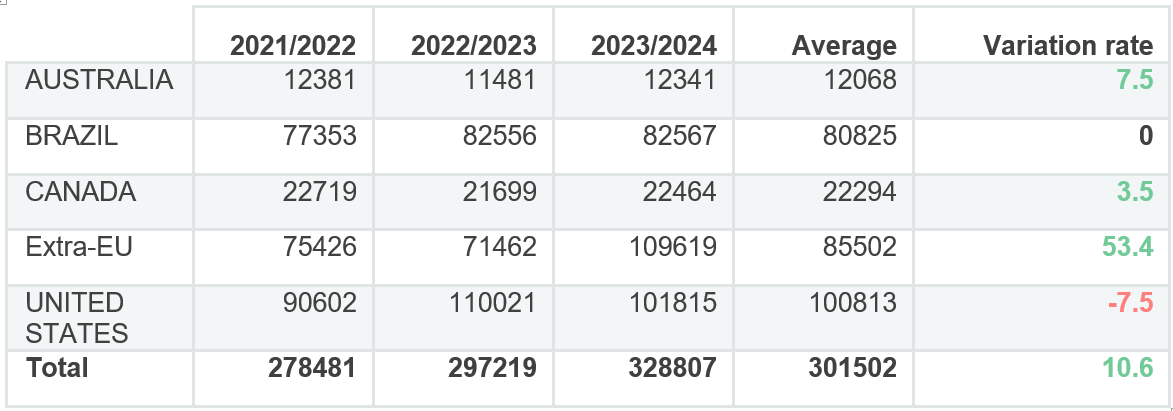
Table 2: Table olive imports from main markets. Volume in tonnes.
In April, EU countries imported over 24,000 tonnes of olive oil (+ 160.4% on the previous crop year or + 10.3% on the previous month). Tunisia is the main supplier of olive oil to the EU: over 16,500 tonnes were imported from this country in April. 68% of all olive oil imported during the 2022/2023 crop year is EVOO.
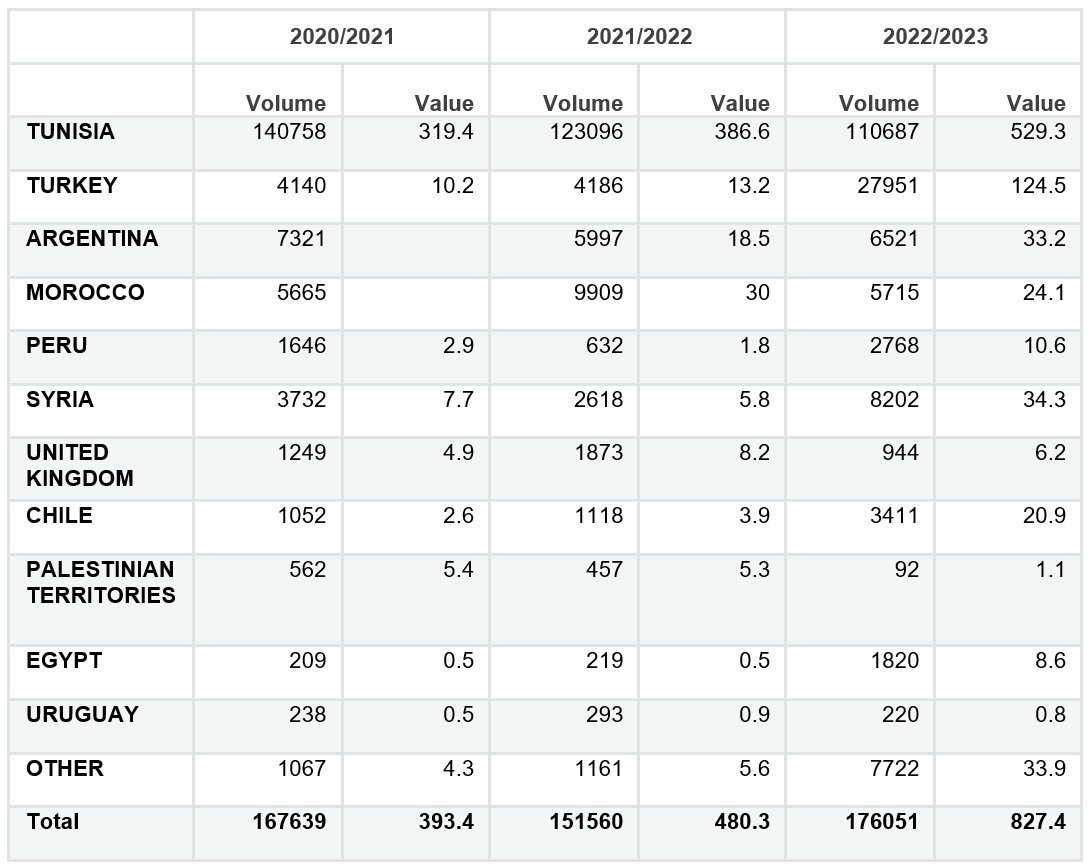
Table 3: Extra-Community imports by partner country and season. Volume in tonnes. Value in millions of euros (CIF).
The harmonized index of consumer prices (HICP) for olive oil in the EU rose by 51.5% in April compared to the same month last year, and by 1.1% compared to March.
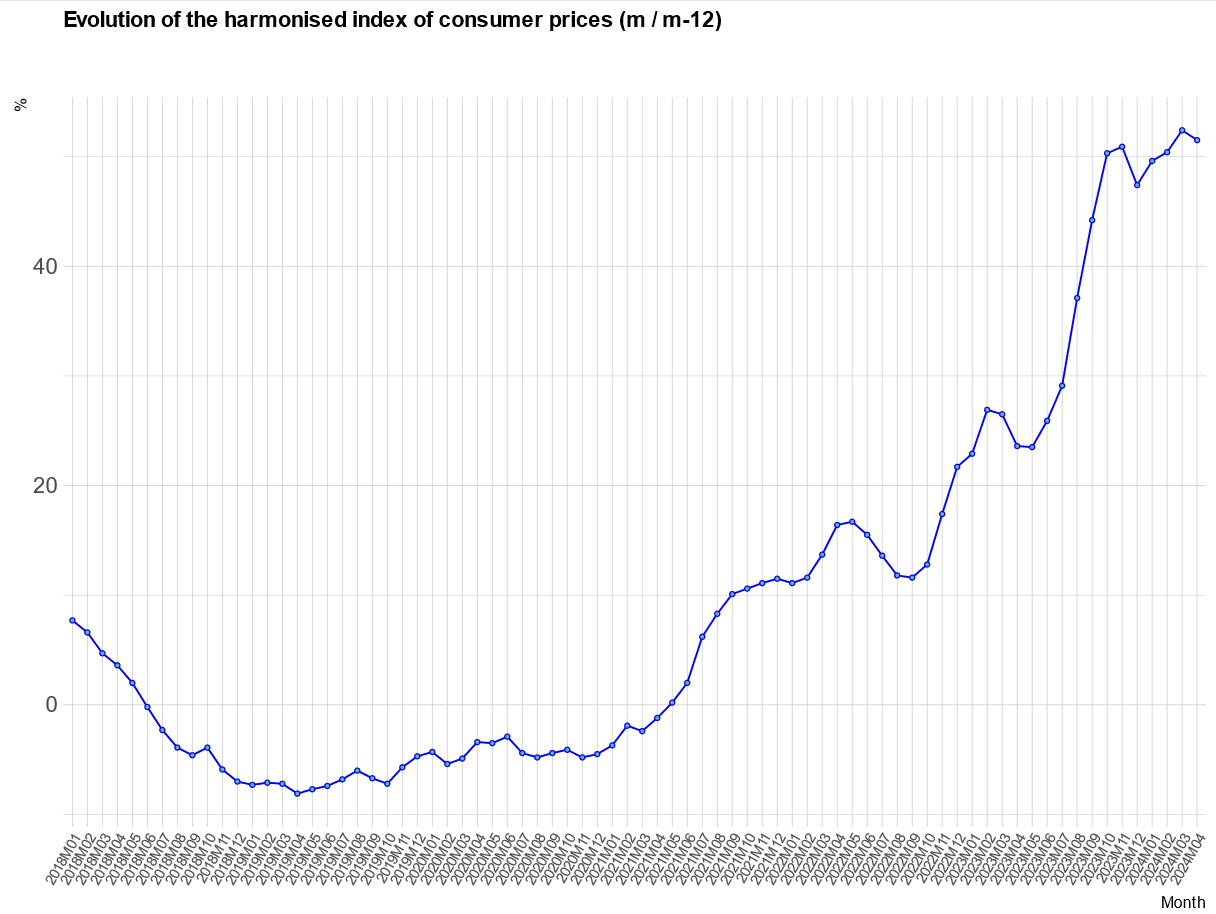
Graph 4: HICP trends for olive oil in the EU-27. Rate of change (m/m-12) (%).
By country, the biggest increases were recorded in France, Finland, Bulgaria, Cyprus, Croatia and the Czech Republic.
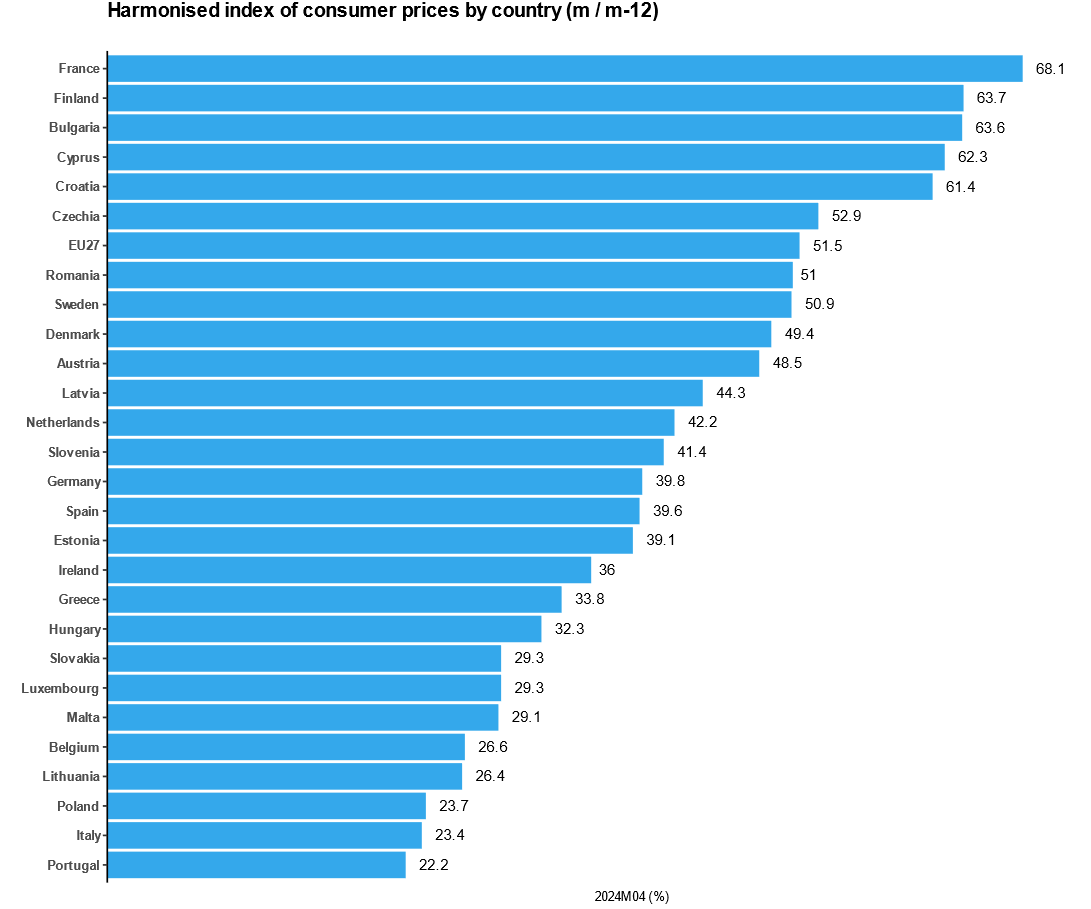
Graph 5: HICP for olive oil by country in the EU-27. Rate of change (m/m-12) (%).
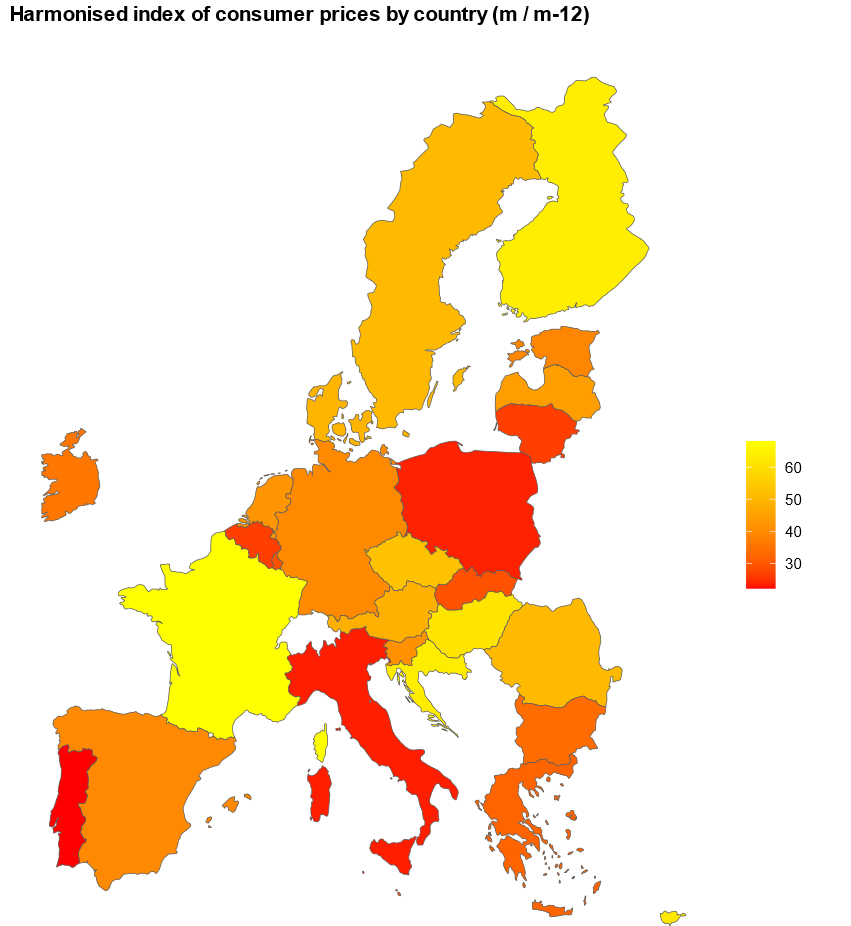
Graph 6: HICP for olive oil by country in the EU-27. Rate of change (m/m-12) (%).
Retour